LEARN-0014Data vizData as of 17 Nov 2026
Born Into It
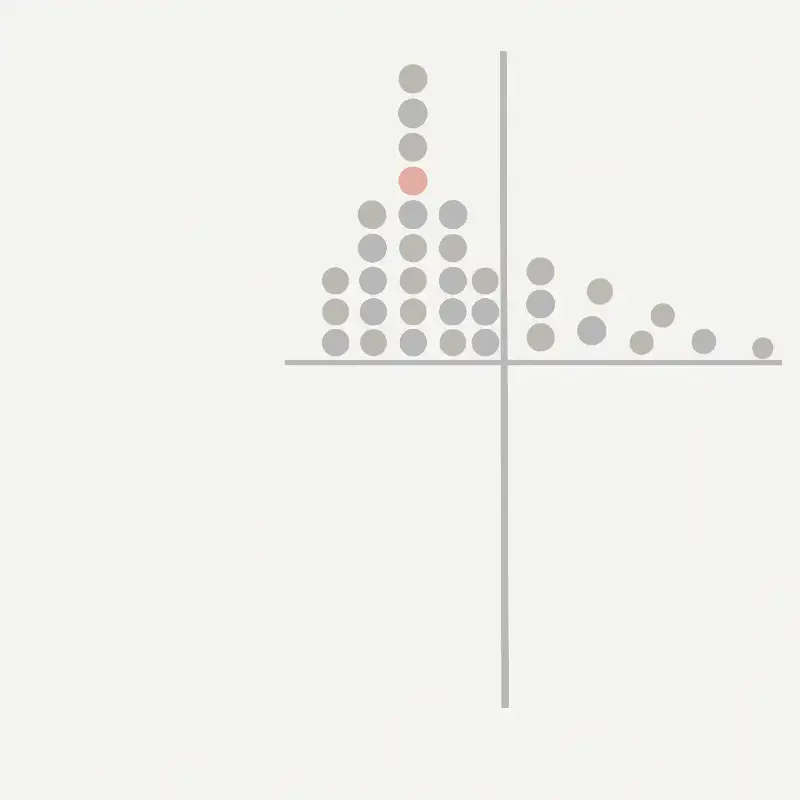
Every year of fossil CO2 since 1750 as one tall stack, cut at the year you were born.
Read ▸

LEARN-0013ExplainerData as of 14 Nov 2026
AI Weight
Of every $100 in an S&P 500 fund, how many dollars ride on the AI-linked giants, set against 2000 and the long normal.
Read ▸
LEARN-0012Data vizData as of 4 Nov 2026
Same Basket
What 2020's grocery money buys in your country now: thirty-six identical baskets that shrink item by item.
Read ▸

LEARN-0011ExplainerData as of 3 Nov 2026
Round by Round
Watch Alaska's ranked-choice count move ballot by ballot, and see why 'narrowly' depends on the round.
Read ▸
LEARN-0010ExplainerData as of 2 Nov 2026
The 80% Line
Drag a household up the income ladder and see where its taxes and Singapore's benefits cross.
Read ▸
LEARN-0009Data vizData as of 1 Nov 2026
Crossover
Watch a country's children thin out and its elders gather as 100 working-age adults age from 1950 to 2100, then see your own birth year and your 65th.
Read ▸

LEARN-0008Data vizData as of 1 Nov 2026
The 73%, one dot per population
Every monitored wildlife population as its own dot, so you can see the crowd the Living Planet Index average comes from.
Read ▸

LEARN-0007Data vizData as of 1 Nov 2026
Dig Site 3026
A deadpan site report from 3026 on seven places people keep their photos, and the year a dig stops finding each one.
Read ▸

LEARN-0006Data vizData as of 28 Oct 2026
The peak-population queue
Every country on one timeline of the year its population tops out, with today marked and a search for yours.
Read ▸
LEARN-0005ExplainerData as of 26 Oct 2026
Hawker salt ledger
Build a day of hawker meals and watch the salt pile up against the 2,000 mg limit.
Read ▸

LEARN-0004ExplainerData as of 25 Oct 2026
PHP, per site, per year
Slide what each PHP site pays and see how many maintainers it would fund beside the Foundation's 2025 team.
Read ▸
LEARN-0003ExplainerData as of 1 Nov 2026
Flightless Bird Fight Card
The official pound-for-pound ranking of birds that cannot fly, with a published methodology and a tale of the tape for any two.
Read ▸

LEARN-0002Data vizData as of 24 Oct 2026
Before you were 18
Enter an age and watch 100 people per mental health condition light up as their first episode passes.
Read ▸

LEARN-0001Data vizData as of 1 Nov 2026
Singapore, as a causal model
Eight official Singapore indicators from 2015 to 2025 as one causal graph, with the decade on a scrubber.
Read ▸